Welcome to our tutorial on viewing website visitor statistics in cPanel using the AWStats program. In this guide, we will walk you through the process of accessing and interpreting the information provided by AWStats, as well as explain the various terms used in the program.
When it comes to website visitor statistics, we provide AWStats. That's why we will be focusing on using AWStats in this tutorial.
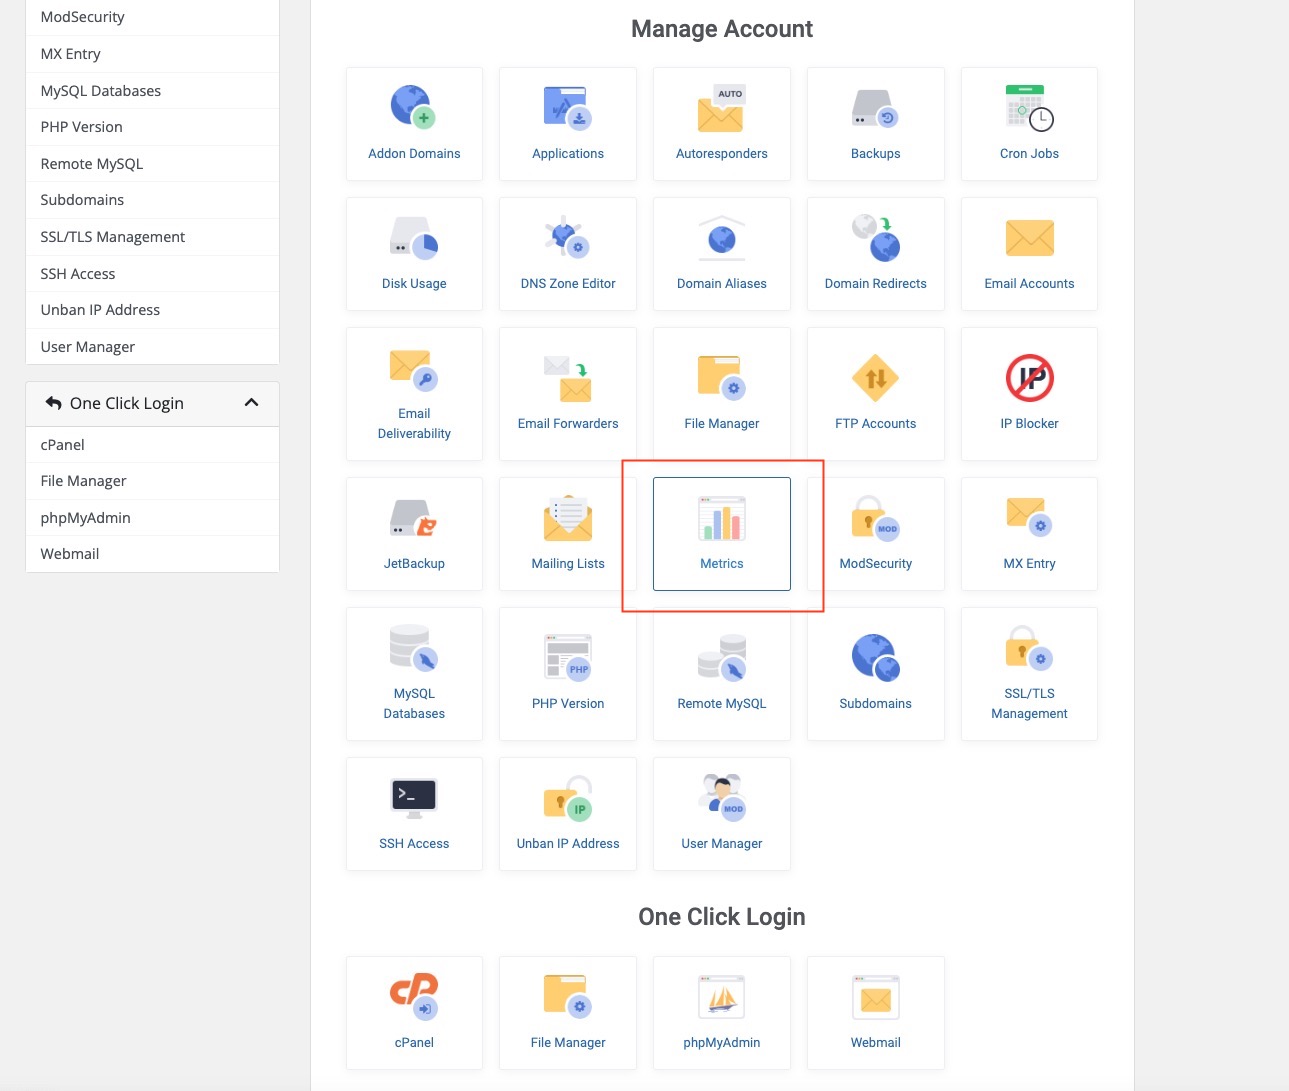
To begin, log in to our Members Portal and navigate to the "Metrics" section after you locate your hosting service then click Manage.

After clicking Manage on your hosting service, you will be taken to that management page.
From there, click on the "Metrics" link or icon. If you have multiple domains in your account, you will be prompted to choose the one for which you want to view statistics.
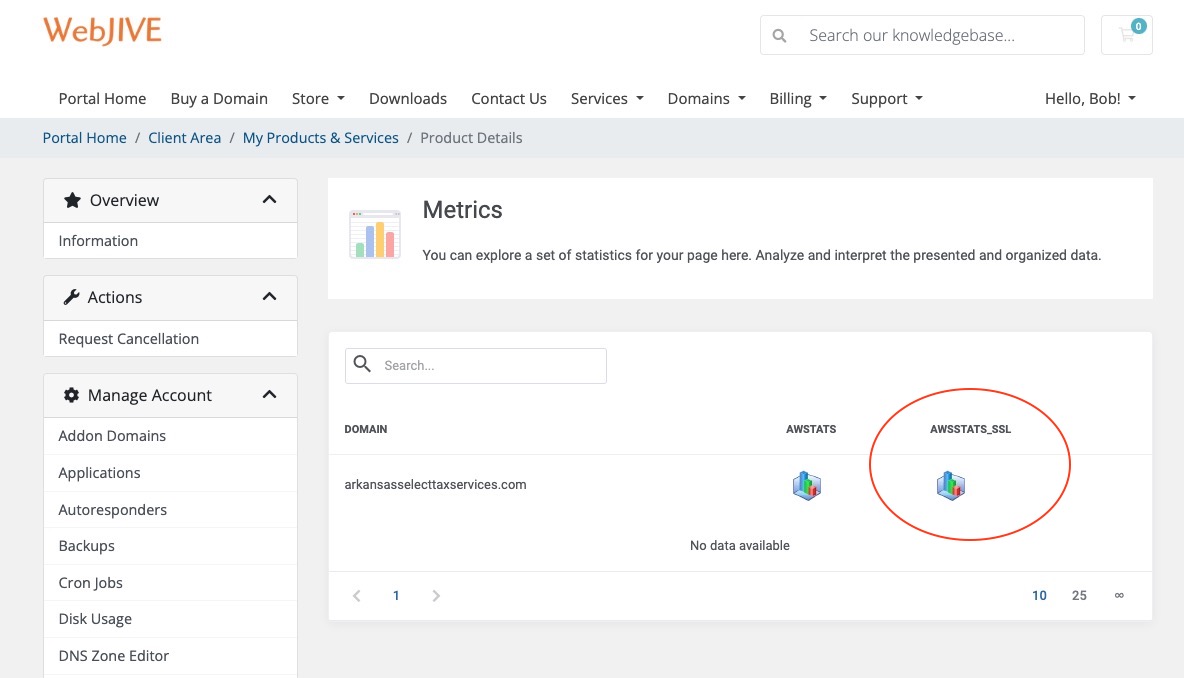
Once you've selected a domain, click on the "AWSSTATS_SSL" link.
When you first access AWStats, you may be overwhelmed by the amount of information on the page. However, you can use the navigation on the left to jump to specific sections. At the top of the page, you'll see the "Last Update" date and time, which is when AWStats last parsed your web server log files. The logs are parsed once a day. You can also choose a different time frame to view by using the "Reported period" line.
The "Summary" section of AWStats highlights several key metrics, including unique visitors, number of visits, pages, hits, and bandwidth. The "Viewed traffic" row shows the traffic from human visitors, while "Not viewed traffic" shows traffic from web crawlers and bots.
To understand the meaning behind these numbers, let's break them down:
- Unique visitors is the number of unique IP addresses in the server logs. It's assumed that each IP represents a unique individual, although this isn't always the case.
- Number of visits, also known as sessions, is the total number of times someone has visited the site.
- Pages is the total number of pages visited by all visitors.
- Hits are the files requested from the server, such as images and pages.
- Bandwidth downloaded is the total bandwidth used to download files.
The "Monthly history" section is a 12-month graph that displays the same categories seen in the summary. This can help you identify seasonal shifts in traffic patterns. Similarly, the "Days of month," "Days of week," and "Hours" sections can reveal patterns in visitor activity that can be useful when planning updates or new content.
Other sections of AWStats also provide valuable information, such as the "Visitor Location and Hosts" section which shows a list of the top 25 countries where your visitors are located and the "Hosts (Top 25)" section which displays the top 25 hosts that have accessed your website.
By understanding and utilizing the information provided by AWStats, you can gain valuable insights into your website's visitors and traffic patterns.
